
Many analytical and reporting systems use data that originated in other systems. In fact often the data has already flowed through multiple systems, receiving additional values, whilst being transformed, combined and aggregated in multiple ways along its journey.
How does an organization understand the true meaning of data served up in a report, or used in an analytical calculation, when its origin and the transformation it has undertaken is not clear?
Without this transparency, it is not possible to ascertain that the appropriate data is being used; it is complete and timely and has not been corrupted along the way.
Achieving transparency around the origins of data is a difficult task because there are typically many technologies involved that have been deployed into the landscape over the years in a piecemeal manner, each focused on the needs of a particular project or functional requirement. There is rarely a well-architected coherent end-to-end implementation that delivers the data. As such, additional techniques need to be employed to piece together the flow of data and the processing that affected it.
There are multiple techniques that can be used to deliver insight into the data flows but each technique has different costs associated with them. The choice of technique depends on the type of question you wish to answer and the level of confidence that you need in the answers.
In brief, the techniques are:
- Design lineage – providing a view on how the systems and the code that copies data between them are linked together to create an end-to-end data flow (also known as an information supply chain). With this type of lineage it is possible to understand the implementation of the data flows to ensure they are appropriate, complete and efficient.
- Business lineage – providing a customized, filtered view of the design lineage focused on specific types of processing and/or key systems. A specialist uses business lineage to verify that the processing is correct.
- Operational lineage – providing operational information that shows when data was copied, how much and the types of errors that occurred. This type of lineage is used to demonstrate that the data flow is operating correctly. It is useful to identify where data has been lost or missed out in the processing, and where errors are occurring in the information supply chain.
- Provenance – provides value-level logging for tracing the origin of a specific data value from original source to destination. This type of traceability is used to verify that an individual data value is correct where as the lineage mechanisms are for proving that the process is correct.
What follows is a description of how these different mechanisms can be implemented. It uses a simple example of a sales report to illustrate the different levels of detail that can be captured and the resulting insight.
The sales report
The sales report example is a monthly report showing the sales made in each country (see figure 1).
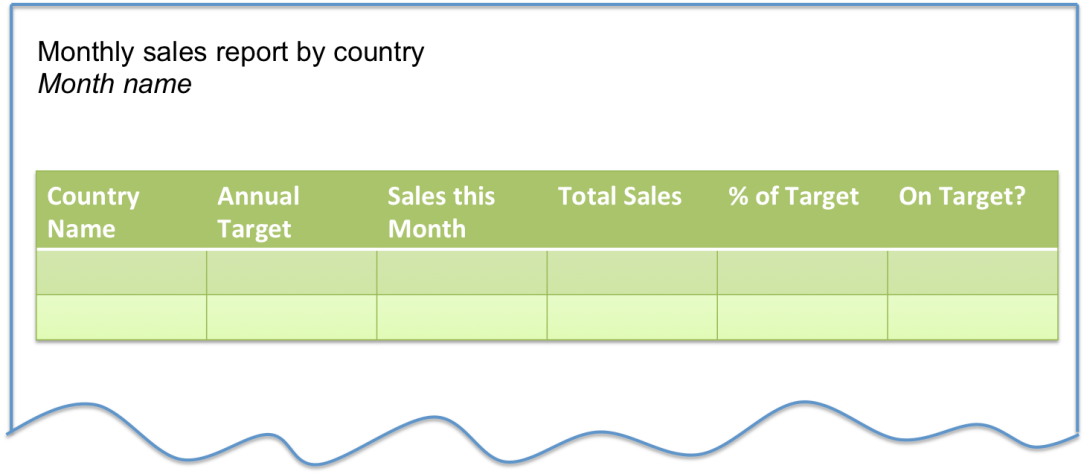
Figure 1: Sales report layout
Figure 2 shows the systems involved in providing data to the sales report. The sales made in the organization’s stores are recorded in regional sales tracking systems (1) and there is also a digital sales channel system (2) for sales through their website. These digital sales are attributed to the country where the order is delivered.
Information from these sales tracking systems are gathered together into a landing area (3) file system and then picked up and complied into the monthly totals within a data mart (4). The final report (5) is assembled by combining data from the data mart with the active targets maintained in the sales management system (6).
![]()
Figure 2: Sales tracking and reporting systems
The data for the report is distributed throughout these systems and is gathered together through a number of different processes. Figure 3 shows the origin of different parts of the report.
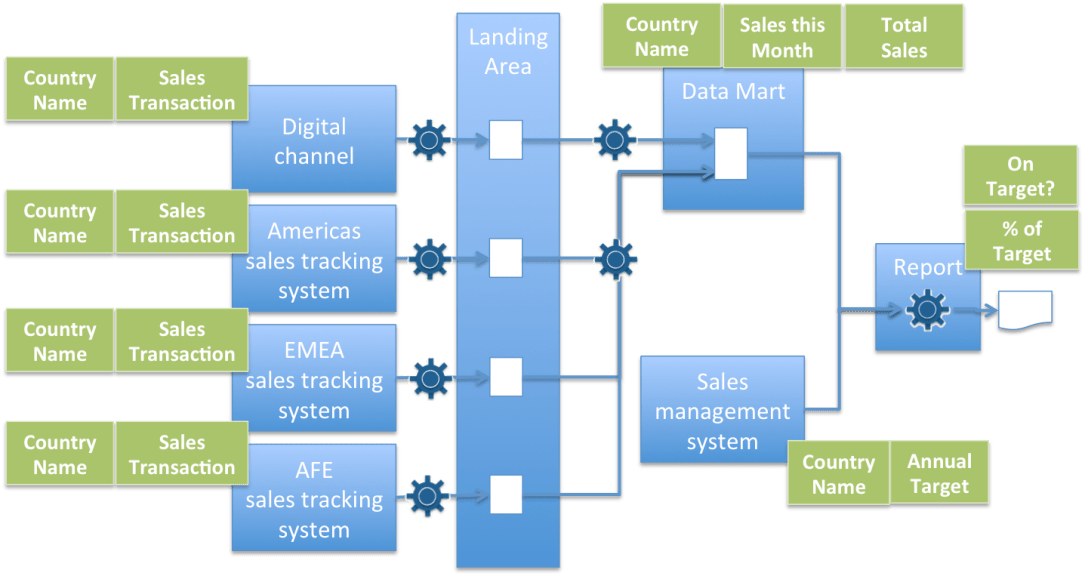
Figure 3: Data origins for the sales report
On the left hand side are the sales tracking systems. They have a record of every transaction and the country where it occurred. These sales records are copied unchanged into the landing area and then they are picked up and aggregated into the data mart. There are 2 different processes running to create the data mart.
- There is one ETL job that runs every day and aggregates the sales from the Americas sales tracking system, EMEA sales tracking system and the AFE sales tracking system.
- There is a message-based process that takes messages from the digital channel sales system and adds the sales transactions they refer to the data mart totals.
The reason there are two processes is that the digital channel sales systems was added many years after the other sales tracking system and no-one wanted to change the original ETL job to add the data from the digital channel – particularly since the processing required is different.
The resulting data mart is queried by the report generation process and combined with the query results from the sales management system that returns the targets for each country. The report generation process calculates the percentage of the target attained for each country and whether they are on target given how far through the year they are.
Even with this simple example report, it is possible to see some of the challenges associated with understanding the origin of data and the processes that copy and transform it. For example:
- Some data values are not stored – they are calculated by code embedded in one of the systems that deliver the data. For example, “% of Target”.
- Some data values are derived from different data values. For example, “Sales this Month” is calculated from adding up the “Sales Transaction”s.
- Some data values occur in every system and are used to correlate data together. (For example, Country Name). An error in these values results in errors in correlating and aggregating data.
- Different systems use different names for the same type of data; or use the same name for different types of data. There are no common standards.
- There are many different types of technology to implement the systems and the processes that copy data between them.
- Different systems use different data formats for the same type of data. The information supply chain has to correctly transform this data to support its use in a downstream system.
So it is a detective job to piece the information supply chain together.
Building an understanding of the information supply chain
The detective work begins with identifying the relevant systems and data values that make up the information supply chain. Typically an information supply chain focuses on:
- The flow of data to a specific report, analytic or application.
- The flow of data related to significant type of data, such as customer or product data.
In this example we will focus on the information supply chain for the sales report. The information supply chain is describes in a metadata repository. Typically it is built up starting at the report end of the information supply chain and working backwards, identifying the data values of interest and describing them in the glossary of the metadata repository: one glossary term for each type of data and one term for the overall report.
Then looking at the implementation of the report, it is necessary to identify the data schemas and the processes (functions) that build the report.
These data schemas and processes are also defined in the metadata repository and linked to the glossary terms. See figure 4.
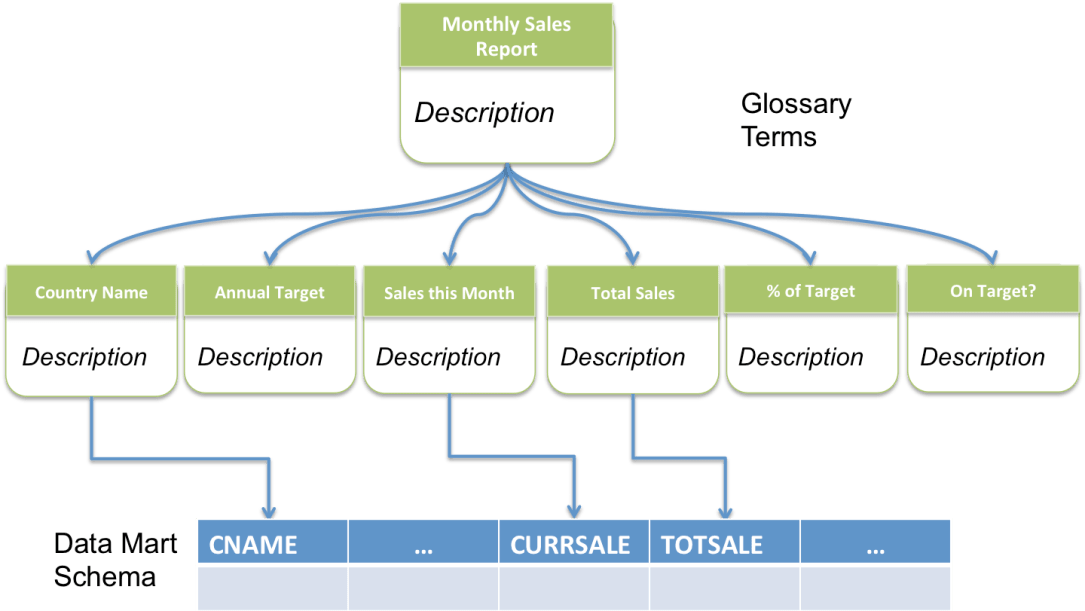
Figure 4: glossary entries for the sales report
When the functions combine different types of data to create the report data values, new glossary terms are created for these types of data and they are linked to the appropriate schema.
This process iterates backwards along the information supply chain by examining the processes that populate the schemas that are identified as part of the information supply chain, documenting them and the schemas they draw data from; then repeating the process until the original sources are encountered.
The result is a glossary with a term for each kind of data requiring traceability and a entry for each type of schema managing that kind of data. There are links between the two.
Design lineage
The process described above provides the foundation definitions for traceability called design lineage. The glossary identifies the schemas where a particular kind of data is stored.
Design lineage shows the tree of processes and data flows that provide data to the report. See figure 5.
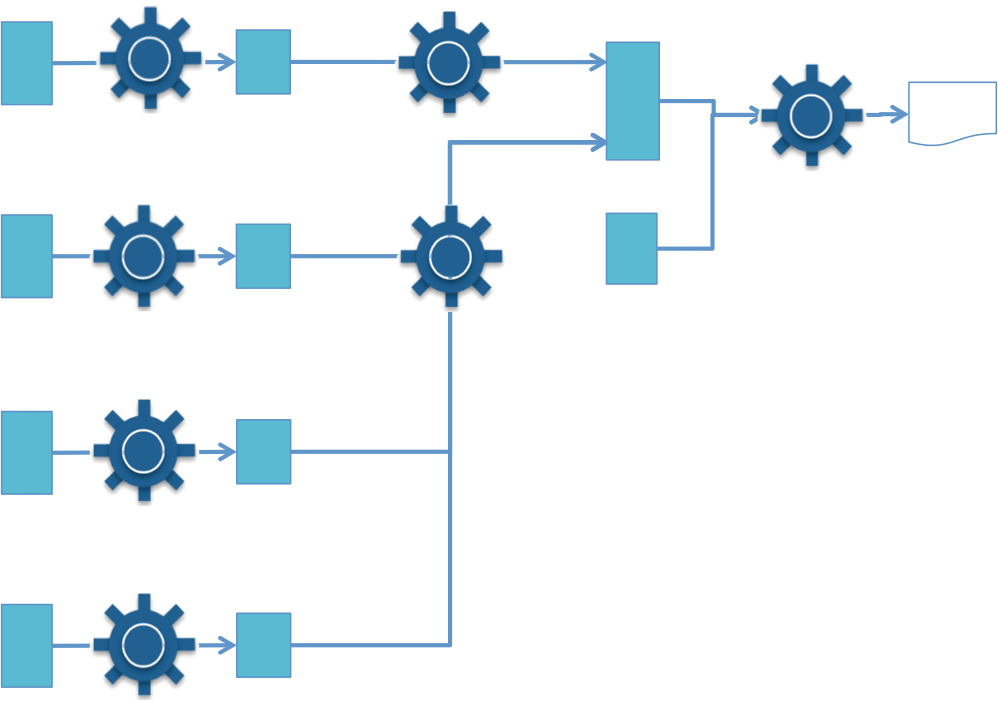
Figure 5: Design lineage for the sales report
Design lineage is often documented by hand. However some tools, typically ETL tools, provide support for design lineage for the parts of the processing that is modeled for their engines. When these tools are in place, it is possible to drill down into their processes to understand the detail of the transformations. (Figure 6).

Figure 6: Drill down of design lineage
The documentation needs to be in a machine readable form connected with the glossary and schema definitions. Ideally it is stored with them in the same metadata repository so that the flow can be connected to the definitions. This makes it possible to dynamically generate reports of different perspectives of the lineage.
Design lineage is a static definition of the implementation. The size and effort associated with the metadata for design lineage is proportional to the complexity (number of systems, schemas and processes) of the implementation rather than the volume of data or the frequency with which data flows. Thus the ongoing cost of maintaining design lineage is determined by how frequently this implementation changes. There needs to be a lineage maintenance step introduced into the change management processes to ensure it remains current.
Business lineage
Design lineage is useful for architects to understand the implementation of how data flows. However, subject matter experts in the business that wish to audit the processing on the data can find it complex to navigate. Business lineage provides simplified views over the design lineage to support different types of analysis by the business. A business lineage report may, for example, only show the major systems, or may eliminate the systems and job structures to only show the transformation. Figure 7 shows a business lineage report for the sales report that focuses only on the functions that create the report data.

Figure 7: Business lineage for the sale report
Since business lineage is derived from the design lineage, there is not additional metadata management required to support it.
Operational lineage
The design and business lineage shows that the implementation of the information supply chain is correct. Operational lineage reveals problems in the ongoing execution of the information supply chain by supplementing the design lineage with logs from the operational environment. These can show how many data items were copied, when and whether there were errors. (See figure 8.)
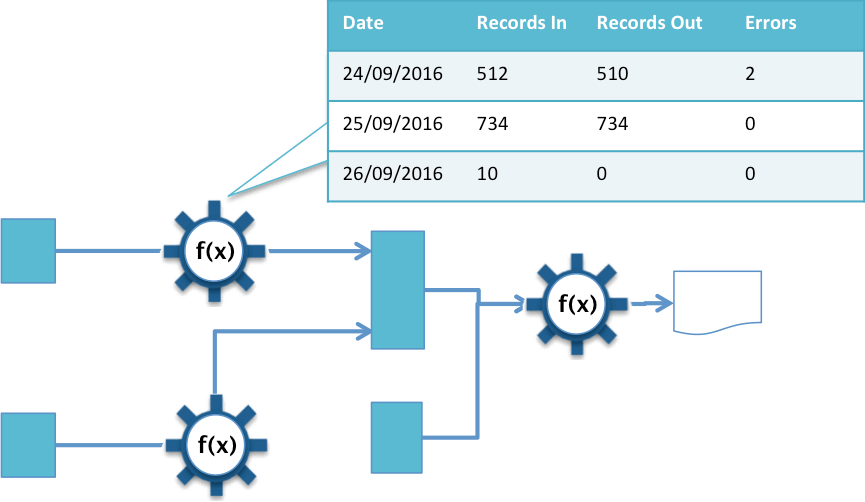
Figure 8: Operational lineage overlay
Since the operational lineage is gathered each time the processes run, its volume is proportional to the level of activity in the information supply chain.
Provenance
The operational lineage demonstrates whether the expected amount of data is flowing through the information supply chain. However, it does not show how a particular value was derived. The process of recording the exact values that were used in each of the functions and transformations on every data value is called provenance.
Provenance requires the logging of all input values and results that flow through the information supply chain in a way that can be correlated with the design lineage.
Provenance can generate a huge amount of logging data that, since it contains the actual data values used, needs the same security protection as the actual data. This provenance data grows in proportion to the amount of data flowing through the information supply chain and the complexity of the processing. Often, provenance data is only gathered around critical transformation processes where value level inspection of the information supply chain is needed. Otherwise the provenance data can become overwhelming.
Making lineage work
The sales report used to illustrate the different types of lineage and provenance in this paper has been chosen to be as simple as possible, whilst still illustrating the different mechanisms. In reality real reports, analytics and the systems that provide data to them are many times more complicated and the landscape is changing continuously.
From the description above, it is easy to see that for a modern enterprise, the process of gathering and managing the metadata needed to provide traceability for data is significant. It needs to be managed as a fundamental IT infrastructure service.
Whatever technology is used to manage lineage and/or provenance, the usefulness of the results will depend on the effectiveness of the processes that surround the lineage tooling. For example:
- Ensuring the design lineage is kept up-to-date as changes are made to the implementation of the information supply chain
- Gathering and preserving the logging data used for operational lineage and provenance.
Many organizations find it impractical to manage lineage and provenance for all of their systems. As a result, they focus on the information supply chains that are core to their business. Ultimately, simplification of the system landscape and information supply chains, standardization of data structures and definition and planning for lineage/provenance data gathering as part of the core function of new capabilities are the key to successful traceability and transparency of data flows.
Photo: Cheetah in Serengeti National Park, Tanzania

3 thoughts on “Understanding the origin of data”