Abstract
An open source project called Apache Atlas was approved as an incubator project on 5th May 2015. This project aims to provide an open metadata repository and information governance frameworks.
The appearance of metadata management in open source offers an exciting opportunity to rethink the way we manage data in data science projects to create trust to both share and consume data.
This blog describes the role of Apache Atlas in changing the availability and quality of metadata, which will in turn improve both the agility of the data scientist and the transparency of the results they produce.
Lies, damned lies and statistics
Whether this is a real quote or not, the phrase “lies, damned lies and statistics” comes to many people’s minds when you ask them what they think about statistics.
There are too many examples of contradictory facts and figures published about our health, the economy, the environment and our society that many people have become suspicious of numerical based evidence.
This is not unreasonable. Even data that has been meticulously captured has some form of bias in it that reflects the reason and context in which it was collected. As a result, two data sets reporting to be about the same situation may legitimately contain conflicting information.
Why does this matter?
Data science has an increasing role beyond bringing additional insight to policy makers. Our world is driven by software; in business, transport, our homes, health and many aspects of our daily lives. Part of this software is analytics – the output of data science. So data, and the services that use it – will be embedded in the infrastructure that drives and supports our society.
What happens if the analytic model is wrong, or there is a problem with the data feeding it, or the way that the results are used? How will we know before disaster strikes? And if disaster does strike through unforeseen circumstances, then how do we restore trust?
This paper is about enabling transparency in the origin and meaning of data, the analytic models that operate on it and the IT systems, processes and people that support it.
Transparency will not prevent inappropriate use of algorithms and data, nor mistakes in interpretation, but it will allow others to verify the usefulness of data and the results of data science. This way it is possible to make an informed decision as to whether to trust a piece of data or not.
A simple example
An ice cream vendor is looking for a reliable estimate of how many ice creams she will sell each day. She observes that the hotter it is, the more ice creams she sells.
The ice cream vendor looks for a data service to help. She discovers one that offers an “ice cream sales” predictive service based on the weather.
The analytic model behind this service was trained with data that records the historical trends of ice cream sales against temperature.
The ice cream seller starts using the service to predict her demand. The service is helpful, but not always accurate which means she sometimes over stocks and other times she runs out of basic ingredients.
Analytics-driven data services may produce the wrong results for a number of reasons:
- The data that is fed into the service is just wrong. For example, if the weather forecast used in the ice cream example is not very accurate.
- The situation that the analytic model is being used for is not appropriate, typically because it inconsistent with the training data used to select and configure the algorithm. For example, if the model was trained with data from Italy and the ice cream seller was using it for the UK. The analytic model in this case could be inaccurate if the ice cream buying habits in Italy are different from those in the UK.
- The model is too simplistic. For example, the ice cream sales may also be affected by humidity, or whether it is the school holidays.
How does the ice cream vendor know that they are using a good data service for their purpose? With a little more information about how the analytic model behind the service works, she, or maybe a data scientist advising her, could understand the behaviour of the service more deeply.
We call this data transparency.
Achieving data transparency
To assess the behaviour of a data service, particularly one that is backed by an analytic model, we need to understand its past, present and future.
The past describes the origin of any data and processing used to create the service; the present is the current way the service is deployed and being used; and its future is a view on the activities that will maintain the accuracy of the analytics over time since the world it is modelling is continuously changing.
When we think about the origin of data, it is rarely sufficient to just know which system supplied the data.
For example, during analytics development, data is typically supplied to the data scientists by a specialist system that maintains historical copies of data from the operational systems. The operational systems are the systems that actually drive the business. Their data is copied and maintained externally for analytics because the workload generated by the data science experiments is uneven and disruptive to the operational systems and operational systems rarely keep enough historical data for analytical exploration.
Operational systems are highly connected and share data. So it may be necessary to trace back through several systems to find the real source of the data.
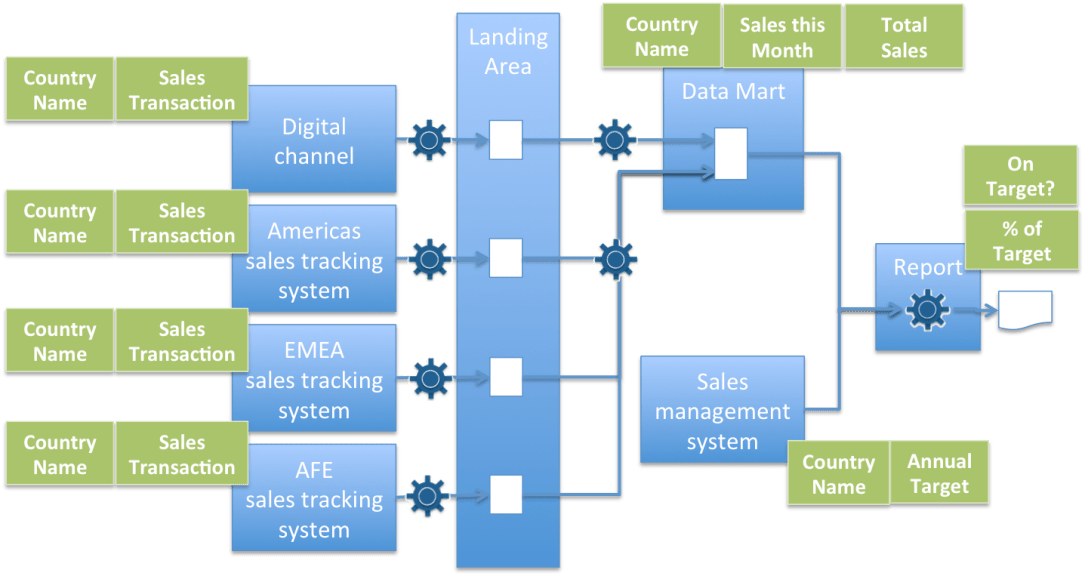
The flow of data through IT systems is called its information supply chain. Data of different subject areas (aka domains or topics) typically each has its own information supply chain. The process of tracking the information supply chains is called lineage.
Lineage creates a record of how the systems that are processing data are linked together and exchange data so it is possible to track down the context and purpose of the data collection in the initial instance – a critical piece of knowledge to be able to determine if the data service is going to provide useful insight.
To understand the usefulness of an analytical data service, we need to understand the lineage of the data used to train the analytic model behind the service, as well as the
lineage used to supply any data to the data service once it is deployed. With this lineage data, and knowledge of the processing that occurred along the information supply chain, it is possible to determine if the resulting model is compatible with the situation (and corresponding data) that the service is to be used for.
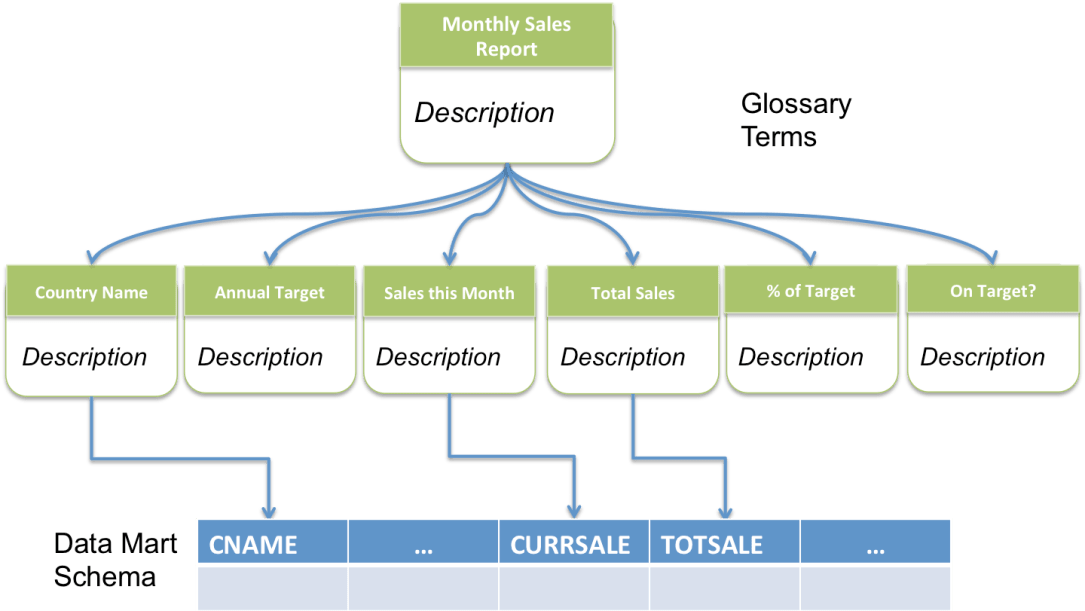
Metadata is the name given to information such as lineage that describes data and processing. Metadata literally means “data about data”.
Metadata comes in many forms and delivers a wide variety of information. However, fundamentally it helps to trace the data’s origin and intent.
Self-service and agility
Metadata has value beyond transparency of analytics. A large part of a data scientist work is locating good data sources.
Metadata describes data in all its forms. This includes where the data is located, how it is stored, how frequently it is changing, what it represents, how it is organized, who owns it and how accurate it is.
Without this type of metadata presented in a searchable form, data-oriented projects are delayed while the team hunts for the data they need. In many data science projects, this process can consume over 70% of the project resource.
Data scientists also need the detailed lineage and knowledge of the source system that created the data in order to correctly align it with a new analytic model.
Adding governance
Metadata does more than describe data. It also encodes the requirements for how it is managed. Typically this is in the form of classification. The classification is attached to the metadata description of the data. This identifies which governance rules apply to this data.
For example, some data might be classified as personally identifiable information (PII). This label then restricts where this data can be used and by whom.
By encoding the classifications and the rules in machine- readable formats, it is possible for a data platform to automate the execution of many governance requirements offering both a cost-effective and reliable governance implementation for many legal and ethical requirements.
Data privacy, rights management, an organization’s own views on their brand image and the industry regulations they must support, can all be supported in this way provided reliable classification metadata is available – and the rules are machine-readable/executable.
Missing metadata
Model transparency, self-service and agility for data science and governance all require pervasive metadata capture, management and sharing.
If metadata is so important to all forms of data-driven processing, why is it rarely available to the data scientist? This comes from the way that metadata is created and managed.
The metadata that most people are familiar with is the metadata associated with a photograph. Most digital camera manufacturers capture information about the light conditions time, location and camera settings when the photo was taken. This metadata is embedded within the photo and is accompanies the photo wherever it is copied to.
The standards associated with photographic metadata help to ensure metadata from different camera manufacturers is available and transferrable between different software packages. However, in all cases, each metadata provider implements the standards in subtly (and not so subtly) different ways, whilst still conforming to the standard. Software packages also tend to wipe out metadata attributes created by another package that it does not recognize.
What is needed is a single implementation that all manufacturers can use creating a consistent approach. This single implementation needs to allow innovation by the manufacturers – but not at the expense of the metadata fidelity. We also need metadata support that covers all types of data.
Most data that drives systems does not flow with the metadata attached as a photo does. Once the data is extracted from a system, it quickly becomes detached from any context information that describes what the data is about. Data integration software that copies data between systems tries to maintain metadata about the systems they are connecting to and the data flows between them to enable lineage, but the coverage is patchy.
A single implementation of the best practices associated with metadata management that is used across software packages would improve the fidelity in which metadata values are handled.
Traditionally metadata management has been providing by specialist tools. Despite the many metadata standards that exist, most metadata capability is specific to particular tool vendors. The metadata capability is added after the system producing data have been running for a while and the process for populating the metadata repository is often laborious and error prone.
Changing the game
In May 2015, a new open source project called Apache Atlas was started to create an open source metadata and governance capability.
The initial focus of the project was on the Hadoop platform, but IBM has been investing in it to broaden its scope, both in the types of metadata it can support, and in the ability to run on different platforms, particularly cloud platforms.
The philosophy of Apache Atlas is that the metadata repository is embedded in the data environment. This means all data activity is captured continuously by default, so there is no need for an expensive and error prone process to populate the metadata repository after the fact.
Already we see the benefit of having an embedded metadata capability in the Hadoop platform, as different components are being extended to log their data assets and activity in Apache Atlas, enabling the capture of lineage flows through multiple processing engines running on the platform.
Can we repeat this success across the majority of data- processing platforms? One priority would be for cloud- based platforms to embed Apache Atlas since it is often hard to keep track of data in a cloud service. In addition, we need a focus on systems where data is being accumulated from multiple sources for ongoing reuse.
Expanding the possibilities
Apache Atlas is in its infancy. How would it need to evolve to support a broader ecosystem?
To ensure Apache Atlas is embeddable in as many technologies as possible, it needs plug points to connect it into the hosting platform’s specific security, storage and network infrastructure.
There are two new challenges that the continuous capture of metadata within a platform creates. Firstly this generates a huge volume of metadata that needs to be continuously and automatically organized, pruned and managed so it is useful. Secondly, the local metadata repository is an island of information, so it is necessary to connect it to other metadata repositories to build up the complete picture of the lineage and data sources available. Both of these aspects must to be addressed to create the broader metadata ecosystem.
Finally we need mechanisms for automating governance and recording the action taken. This is necessary to enforce standards and legal obligations in the data creation, management and usage.
Thus I am recommending the addition of three new frameworks in Apache Atlas:
- The open connector framework provides a common mechanism to access data and its related metadata. The connector is able to blend metadata stored with the data with the metadata managed in an Apache Atlas metadata repository with the context information from the execution environment to create a simple interface for tools and developers to make use of the metadata. The connectors also call the governance action framework.
- The governance action framework is called to execute automated governance actions, such as masking when particular conditions are met. Typically the governance action framework is called from the connector framework when data is created, updated, deleted or accessed. However, it can be called at other times, for example, when new processes are deployed, or to select between different connectors.
- The discovery framework orchestrated pipelines of discovery analytics to enhance and maintain metadata automatically as the data stored in the platform changes.These capabilities are added as frameworks rather than closed component to enable future innovation by all types of organizations.
The open source project will offer basic function by default. These can be augmented through open interfaces with advanced function sold commercially or developed in house.
Building the ecosystem
For Apache Atlas to be sustainable, it needs a broad community of contributors and consumers from across commercial, government and academic organizations.
Through ongoing activity, the project will grow both in capability and in the confidence that people will have to invest in it.
The broader the adoption, the more metadata will be stored in open formats and managed thorough well-defined and open governance processes.
As a result, vendors, consuming organizations and researchers that work within the ecosystem will benefit in working with more discoverable and assured data, and so a network effect is created that will be self-sustaining and increase the data available for advanced data driven services.
Getting involved
If the Apache Atlas project seems of interest then there are the following suggestions on how to get involved:
- Direct code contribution to the Apache Atlas project. There are many features that still need to be coded.
- Research into automation around the identification, capture and maintenance of metadata. Automation keeps the cost of metadata management to a minimum and often improves it accuracy.
- New standards for exchanging governance and lineage metadata between metadata repositories, and ways to encode metadata into data flows.
- Encouraging vendors/partners and projects internal to your organization to embrace Apache Atlas and its standards to grow the ecosystem of data and processing that is assured by metadata and governance capability.
Data is too important to allow metadata management and governance to be an optional extra for a computing platform. This is an opportunity to make an important step forward in the usefulness, safety and value associated with data driven processes and decisions.
Additional information
The following URL links to a blog series that provides additional information about open metadata and governance and the Apache Atlas project
Acknowledgements
I wish to thank my IBM colleagues for their support in making open metadata and governance with Apache Atlas a reality. In particular, Tim Vincent, Dan Wolfson, David Radley, Nigel Jones, Graham Wallis, Albert Maier, Ernie Ostic, Jay Limburn, Cassio Dos Santos, Bhanu Mudhireddy, and Dave Kantor.
Photo: Strokkur Geyser, Iceland